Swindon Fly-Tipping Report 2025
From dumped sofas behind terrace rows to bags of household waste left beside Swindon’s busy communal bins, fly-tipping continues to blight neighbourhoods and green spaces across the borough. Swindon, like many growing towns, is seeing an upward trend in fly-tipping reports.
In this article, we unpack the latest figures, pinpoint local hotspots, reveal what kinds of waste are turning up most often, and explain how the council — and local residents — are working to keep Swindon cleaner and safer for everyone.
How many fly-tipping incidents are reported in Swindon each year?
According to the latest government data on fly-tipping incident reports in England:
- In the year ending March 2024, there were 3,405 reports of fly-tipping in Swindon.
- That’s 14 incidents per 1,000 people, which stands below the national average of 20 fly-tipping incidents per 1,000 people.
- However, between March 2023 and March 2024, the number of fly-tipping cases rose by 79%, up from 1,930 incidents the previous year.
- This recent spike is a reversal of the steady decline seen from 2014 to 2020, when incidents fell from nearly 3,000 to just over 700.
Where does fly-tipping occur most in Swindon?
Fly-tipping continues to be a challenge in Swindon. So, where are incidents happening most frequently? The latest data shows:
- In the year ending March 2024, 69% of all fly-tipping incidents in Swindon occurred on council-owned land such as parks and play areas, totalling 2,362 reports.
- The next most affected areas were footpaths and bridleways, with 706 incidents (21% of all incidents), and private residential land, with 178 incidents (6%).
- Smaller numbers were recorded in unidentified areas (95 incidents), back alleyways (50), highways (9), and commercial land (5).
- As of 12th June 2025, FixMyStreet data shows high numbers of fly-tipping cases in areas to the north and east of Swindon town centre, including Rodbourne, Gorse Hill, New Town, and Penhill (below).
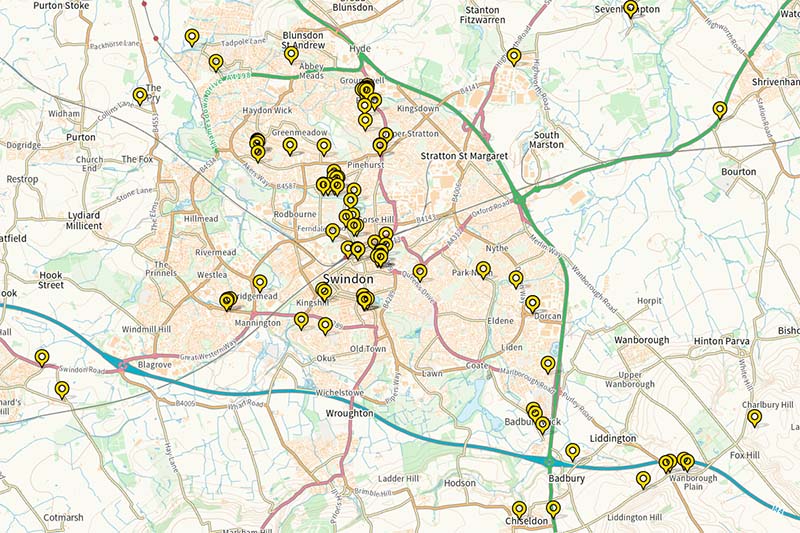
Map showing 315 active fly-tipping incidents, concentrated in the north and east of Swindon town centre (FixMyStreet, 23rd January 2026)
What types of waste are most commonly fly-tipped in Swindon?
Now that we know where fly-tipping is happening, here’s a look at what type of waste is being illegally dumped in Swindon. According to government figures for the year ending March 2024:
- The most frequently recorded waste type was unidentified waste – a category used when the waste doesn’t fit standard classifications or can’t be clearly identified. There were 1,072 incidents recorded under this category last year.
- The second most common waste type was miscellaneous household waste – including items from house or shed clearances, old furniture, carpets, and small-scale DIY debris – accounting for 1,009 incidents.
- This was followed by household rubbish in black bags (790 incidents), construction-related waste (179), miscellaneous commercial waste (113), and white goods such as fridges and washing machines (108).
How do Swindon’s fly-tipping statistics compare to other areas in the South West?
Fly-tipping levels vary widely across South West councils. Compared to other areas in the region, how does Swindon’s fly tipping figures compare?
- Out of 27 local authorities in the South West, Swindon recorded the fourth highest number of fly-tipping incidents in the year ending March 2024, with 3,405 reports.
- Cornwall reported a similar number (3,101 incidents) — despite having more than twice the population of Swindon.
- Bristol had the highest number of incidents in the South West, with 8,556 reports, followed by Plymouth with 5,745.
- When looking at fly-tipping rates relative to population, Plymouth had the highest in the region, with 21 incidents per 1,000 people, followed by Bristol (18 per 1,000), the Forest of Dean (15 per 1,000), and Swindon (14 per 1,000).
The table below shows the Southwest local authorities with the highest number of fly-tipping incidents per 1,000 people in the year ending March 2024:
| Rank | Local authority | Total incidents per 1,000 people |
|---|---|---|
| 1. | Plymouth | 21 |
| 2. | Bristol | 18 |
| 3. | Forest of Dean | 15 |
| 4. | Swindon | 14 |
| 5. | Cheltenham | 12 |
| 6. | Bath and Norst East Somerset | 12 |
| 7. | Cotswold | 11 |
| 8. | Gloucester | 10 |
| 9. | Stroud | 9 |
| 10. | North Somerset | 9 |
What legal actions are taken against fly-tipping in Swindon?
Fly-tipping is a criminal offence, and like other councils across England, Swindon Borough Council can issue fixed penalty notices to those caught dumping waste illegally. Under UK law, the most serious fly-tipping offences can result in fines of up to £50,000 and up to five years’ imprisonment. However, government data for last year shows that:
However, government data for last year shows that:
- Only 8% of fly-tipping reports in Swindon led to any formal action — just 277 actions in total.
- Of these, 208 were investigations and 69 were warning letters.
- No fines or fixed penalty notices were issued in Swindon that year.
- To put this into context, Swindon is one of eight councils — along with Torridge, West Devon, South Hams, Bournemouth, Cheltenham, Exeter, and the Isles of Scilly — that did not issue any fixed penalty notices for fly-tipping.
- Across the South West, Plymouth issued the highest number of fixed penalty notices for fly-tipping, with 117 in total.
How Swindon is working to reduce fly-tipping
In 2024, the council announced a tougher approach to tackling fly-tipping, with plans to issue fixed penalty notices starting at £400 to anyone caught illegally dumping rubbish. Residents are also encouraged to report fly-tipping through the council’s online portal and to always use licensed waste carriers for proper disposal.
This is where HIPPO can help. Whether you need skip hire, a HIPPOBAG collection or Man and Van rubbish removal, HIPPO makes it easy to dispose of waste responsibly. Our Swindon waste disposal services are fast, reliable and fully compliant with UK waste regulations — and our friendly team is always here to help.